Power BI
Let us help you define the right usage scenario for your company and get a head start with your Power BI deployment project?
Power BI has since 2012 matured its technology and has more or less become one of the most popular dashboard tool of today. Comitto Group has been following and still is, the continued development of features and possibilities, which is currently released every month. We have done large scale deployments and assisted in formulating strategies for optimal use and making it an everyday tool for all company employees.
Let us help you find the optimal way of utilizing this ecosystem, and release the new way of sharing knowledge from your company data.
If you find the rest of this page too technical hand it over to your IT-staff or give us call for arranging a face to face presentation of how to make Power BI a valuable investment for your company.
The Power BI ecosystem is very flexible and can be utilized in several different types of circumstances. We will here present a common usage scenario to illustrate one way you might deploy Power BI.
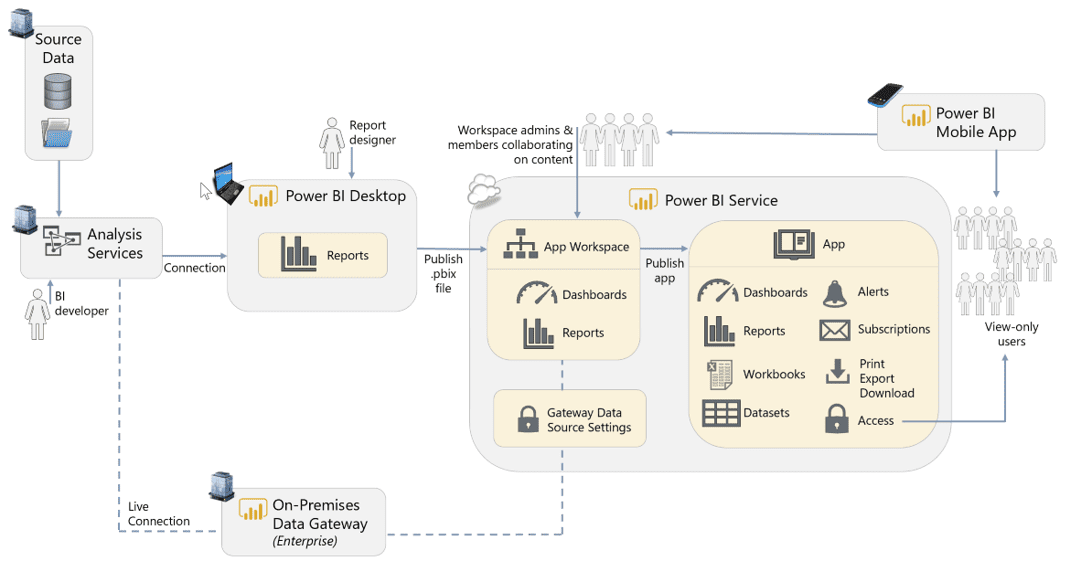
The objective here is not to call out a “One fits all” standard option for a usage scenario – rather, like the diagram illustrates the primary features to investigate for a typical scenario. It is very possible you will “mix and match” ideas presented here to formulate a BI strategy that fits your situation.
There are a number of options for delivering Corporate Reporting scenarios. This scenario illustrates one such option, in which Power BI can work like any other reporting tool which issues queries to retrieve data on-demand when a report is viewed.
This Corporate Reporting scenario focuses on how Power BI can reuse existing centralized data models stored in services like Analysis Services e.g. existing Cubes or tabular models.
Power BI Desktop. In this scenario, the authoring experience becomes significantly simplified because only reports are set up in the .pbix file. Queries, calculations, and the dataset are largely omitted (with the exception of report-level measures) because they are all handled in a centralized semantic layer such as Analysis Services.
Analysis Services. Having a centralized, user-friendly, semantic layer such as Analysis Services helps organizations work towards achieving “one version of the truth” and reduces duplicative copies of datasets. For companies which have made an investment in a semantic layer, Power BI can take advantage of it. Depicted above is an on-premises SQL Server Analysis Services, along with an On-Premises Data Gateway. Azure Analysis Services, a PaaS offering in Azure, is a viable alternative as well.
DirectQuery functionality (for a relational data source like a data warehouse) or a live connection (for an Analysis Services data source which serves as a semantic layer) can be utilized.
In Corporate Reporting scenarios, it is valuable to have the data remain in a centralized system, and not loaded to Power BI, as shown in the above diagram. We recommend educating users to think carefully before choosing to import data into Power BI.
Do you need a strong BI partner?
Fill out the form and we will contact you.


